Urban Heat Island Mapping Saudi Arabia
Thermal satellite analytics that identify urban heat islands, surface temperature patterns and cooling opportunities in built environments.
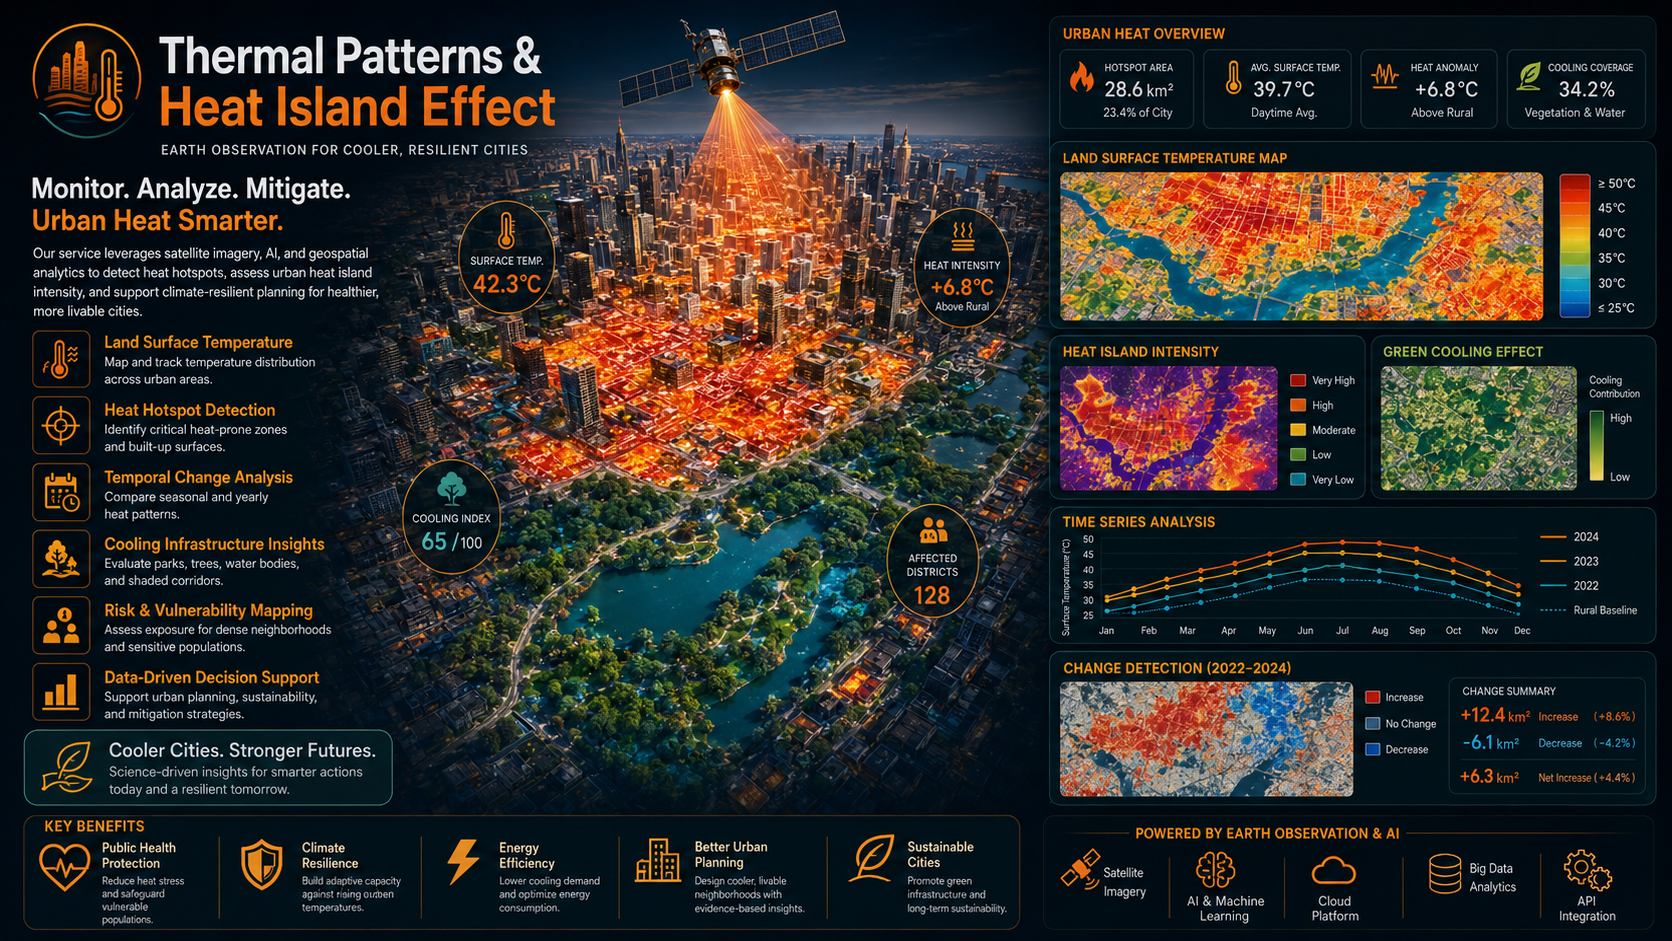
What Thermal Patterns & Heat Island Effect helps you do
Thermal Patterns and Heat Island Effect analysis helps municipalities and developers understand where heat accumulates and why. It identifies hot surfaces, heat-stressed districts and cooling opportunities linked to materials, land cover, shade and vegetation.
EnmaTech analyzes thermal imagery with land cover and urban morphology layers to highlight priority zones. The outputs help planners compare neighborhoods, evaluate mitigation measures and design evidence-based cooling strategies.
Typical deliverables
- Surface temperature maps
- Urban heat island priority zones
- Cooling opportunity analysis
- Thermal planning report
Applications
- Urban heat island mapping
- Environmental management
- Emergency heat risk planning
- Cooling strategy evaluation
Benefits
- Clear heat exposure maps
- Better climate adaptation planning
- Priority zones for mitigation
- Evidence for municipal decisions
A clear workflow from data to action
The workflow can be adapted for one-time studies, monthly monitoring, event response or long-term operational reporting.
Scope the area
Define assets, boundaries, risks, frequency and reporting needs.
Process data
Use satellite, UAV, GIS and contextual data to extract indicators.
Validate insights
Review outputs against project context and available field information.
Deliver outputs
Provide maps, GIS layers, dashboards or reports for decision makers.
Plan a Thermal Patterns & Heat Island Effect assessment
Share your area of interest and monitoring objective, and EnmaTech can prepare a suitable Earth observation workflow.